IoT Dataset
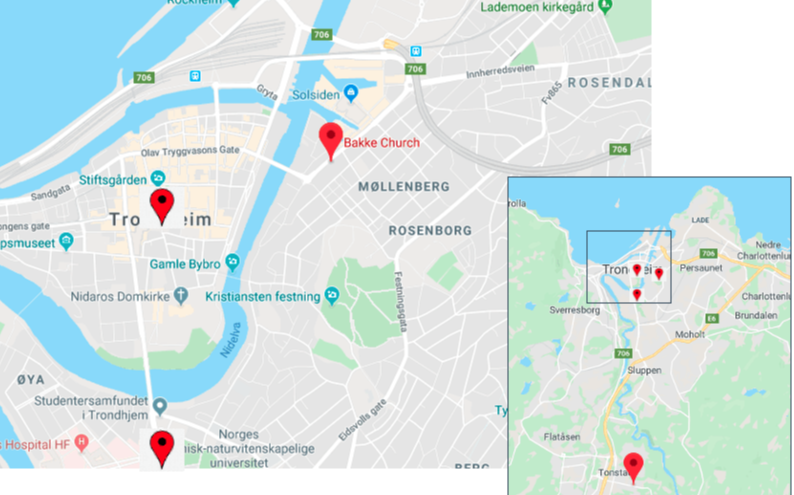
This dataset refers to data collected in Trondheim and includes pollution readings from 4 stations and weather (wind, rain, temperature, pressure). Pollution stations are located as indicated. All datafiles are included in a zip file together with details in a PDF presentation. Download the resource from AI4EU platform (see updated description below)
Brief description of the data
1
Pollution Data
Readings every hour from Jan 1, 2014 to Jun 7,2019 for particles PM10, PM25 and NO2 collected in four stations: Bakke kirke; Elgeseter; E6-Tiller; Torget. Details http://luftkvalitet.info/Cities/Tronheim.aspx
File "TrondheimIoTDataset.xlxs" contains the original raw data.
2
Matlab data files:
There are two matlab data files:
PollutionDataOnly.mat : Data is ordered by timestamp one sample every hour, from Jan 1, 2014 00:00 (timestamps{1} until July 29 23:00 Variables : origdata - original data (missing readings are NaN), datafilled - completed data.
PollutionData_completed.mat : The same information as above but with different organizations:
pollutionday : matrix 288x2036 where each column is data of one day (4 stations x 3 pollutants x 24 hours) and 2036 days (columns)
pollutionhour: each column represents full data (2036 days x 24 hours) for each of the pollutants and stations.
3
Traffic Data
Data from traffic counters were collected from public sources and include in an Excell file